The box score alone doesn’t lie, but it also doesn’t tell the full story unless you’re willing to look at it with intent. The 49ers vs New York Jets Match Player Stats from their most recent meeting make one thing clear: this wasn’t a close contest disguised by a respectable final score. San Francisco dictated pace, controlled the ball, and forced New York to play a game it never wanted. If you care about how football games are really decided, the numbers here are blunt and revealing.
The Jets had moments. The 49ers had command. That difference shows up everywhere once you stop skimming and start reading the stats with purpose.
How San Francisco Used Possession to Suffocate the Jets
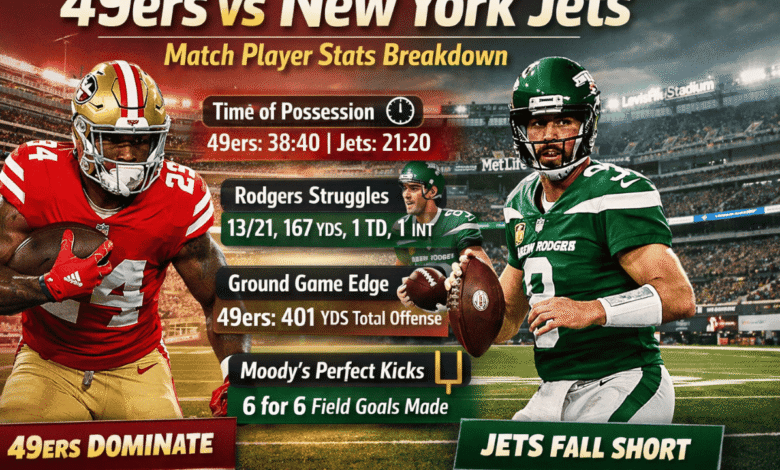
Time of possession isn’t a vanity stat when it’s this lopsided. San Francisco held the ball for nearly 39 minutes. The Jets barely cracked 21. That gap alone explains why the 49ers vs New York Jets Match Player Stats tilt so hard in one direction.
Sustained drives drained the Jets’ defense and erased any rhythm their offense tried to build. The 49ers weren’t chasing chunk plays all night. They stacked first downs, forced New York into base packages, and turned every Jets stop into a short-lived victory. By the fourth quarter, the Jets defense wasn’t failing because of talent. It was failing because it had been on the field too long.
First downs tell the same story. San Francisco finished with 24. New York managed 14. That difference doesn’t come from one big drive. It comes from methodical execution over four quarters, the kind that never shows up in highlight reels but always decides games.
Quarterback Output That Looks Better on Paper Than on the Field
Aaron Rodgers’ stat line reads fine at a glance. Over 160 passing yards. A touchdown. Completion percentage north of 60. But the 49ers vs New York Jets Match Player Stats expose how limited his impact really was.
Most of Rodgers’ production came in short windows, often when the Jets were already trailing and San Francisco was content to trade yards for time. He rarely pushed the ball vertically with success. When he tried, the 49ers’ coverage forced hesitation or mistakes. The interception wasn’t a fluke. It was the product of pressure and disguised looks.
Tyrod Taylor’s brief appearance added a touchdown, but it didn’t change the flow. The Jets’ quarterback production lacked sustained threat. No long drives. No repeated third-down conversions through the air. Against a defense built to swarm and rotate, that’s a losing formula.
On the other side, San Francisco’s quarterback play didn’t need fireworks. The offense functioned as designed. Protect the ball. Distribute touches. Keep the chains moving. The lack of gaudy passing totals wasn’t a weakness. It was evidence of control.
The Ground Game Gap That Decided Everything
If one stat category explains the outcome more than any other, it’s rushing efficiency. The 49ers vs New York Jets Match Player Stats show San Francisco consistently winning on early downs, while New York struggled to make the run game matter.
Breece Hall found the end zone, but his yardage came with effort. Sixteen carries for just over 50 yards tells you how tight the lanes were. The 49ers closed gaps quickly and forced Hall to bounce runs sideways. A rushing attack can survive low averages if it controls tempo. The Jets’ couldn’t.
San Francisco’s approach was simpler and more effective. Rotate backs. Hit creases. Accept four- and five-yard gains without forcing anything. That patience paid off in field position and clock control. Every successful run set up manageable third downs. Every manageable third down extended drives. By halftime, the pattern was locked in.
Receiving Production Without a True Difference-Maker
The Jets’ receiving numbers look spread out, but that’s not a compliment. The 49ers vs New York Jets Match Player Stats show no New York receiver consistently winning matchups or flipping field position.
Short completions kept drives alive briefly but rarely threatened the defense. San Francisco’s secondary rallied fast and tackled cleanly. Yards after catch were limited. Explosive plays were almost nonexistent.
San Francisco’s receivers didn’t post massive totals either, but context matters. Deebo Samuel’s involvement forced defensive adjustments even when he wasn’t targeted. Brandon Aiyuk and George Kittle moved the chains when needed. The offense didn’t rely on one hot hand. It relied on leverage and spacing.
That balance kept the Jets guessing and prevented any single coverage adjustment from working for long.
Third Downs and the Quiet Importance of Manageable Situations
Third-down conversion rates often get mentioned, then ignored. Here, they matter. Both teams converted six third downs. The similarity ends there.
San Francisco’s third downs were shorter. New York’s were longer and harder. The 49ers vs New York Jets Match Player Stats don’t explicitly list average third-down distance, but the drive results make it obvious.
When the 49ers reached third down, it was often third-and-three or third-and-four. When the Jets did, it felt like third-and-eight. That difference changes play-calling, protection, and risk tolerance. San Francisco stayed aggressive. New York played cautiously and paid for it.
Special Teams That Quietly Tilted the Field
Field goals don’t excite fans, but they win games when they stack up. San Francisco’s kicker converted six times. Six scoring drives ended with points. No wasted possessions. No momentum killers.
That reliability forced the Jets to chase touchdowns instead of trading scores. Every stalled Jets drive became more damaging because San Francisco kept adding points without taking risks. The 49ers vs New York Jets Match Player Stats show a scoring gap that widened through discipline, not desperation.
Defensive Pressure That Never Needed Blitzing
One of the most telling elements buried in the stats is what isn’t there. Blitz-heavy pressure. Sack totals inflated by risky calls. The 49ers didn’t need that.
They generated pressure with four. They closed passing lanes without selling out. Rodgers was forced to throw early, check down, or throw the ball away. That kind of defensive performance doesn’t always pop statistically, but it erodes offensive confidence snap by snap.
The Jets’ defense, by contrast, spent too much time reacting. Even when they held San Francisco to field goals, the cost was fatigue and field position.
Why These Stats Matter Beyond One Game
It’s tempting to treat the 49ers vs New York Jets Match Player Stats as a one-week snapshot. That misses the point. These numbers reflect identities.
San Francisco plays a control-based game built on discipline, depth, and patience. New York, in this matchup, relied too heavily on isolated moments and struggled when forced into sustained execution.
Stats like time of possession, first downs, and red-zone efficiency don’t fluctuate wildly by accident. They show preparation and structural strength. Until the Jets can flip those fundamentals, similar matchups will keep ending the same way.
What the Jets Failed to Do That Changed Everything
The Jets didn’t lose because of one turnover or missed tackle. They lost because they never dictated terms.
They didn’t establish the run early. They didn’t flip field position. They didn’t force San Francisco out of its comfort zone. The 49ers vs New York Jets Match Player Stats reveal a team reacting instead of leading, and that’s fatal against a roster built like San Francisco’s.
Reading the Numbers Without Excuses
Blaming injuries or timing doesn’t hold up when the stat gaps are this wide. The 49ers vs New York Jets Match Player Stats show dominance in possession, efficiency, and situational football. That’s not noise. That’s structure beating improvisation.
If New York wants different results next time, the fix isn’t flashier play-calling. It’s boring, hard work in early downs, protection consistency, and defensive stamina.
San Francisco didn’t win this game with highlights. They won it by refusing to give the Jets control of anything that mattered.
The takeaway is simple and uncomfortable. When you read the 49ers vs New York Jets Match Player Stats honestly, you’re not looking at a close contest. You’re looking at a game decided long before the final whistle, one possession at a time.
FAQs
- Which stat best explains why the 49ers won this matchup?
Time of possession. Holding the ball for nearly 39 minutes limited the Jets’ opportunities and wore down their defense. - Did Aaron Rodgers play poorly based on the stats?
Not outright poorly, but his production lacked impact. The numbers look decent until you factor in game flow and pressure. - Why didn’t Breece Hall’s touchdown change the game?
Because the Jets couldn’t sustain drives. One score doesn’t offset repeated short possessions. - How important were field goals in this matchup?
Critical. Six successful field goals meant every productive drive ended with points, keeping constant pressure on the Jets. - Do these stats suggest a gap in team quality or just game execution?
Both. Execution exposed a structural gap, especially in controlling tempo and early downs.